|
|
Post by bantam147 on Oct 20, 2018 16:28:42 GMT
After today’s results it’s official. In 2018, of the 92 professional clubs in England we have the fewest points. The worst team in the country.
Edin knows football.
|
|
|
|
Post by Dick on Oct 20, 2018 16:39:09 GMT
Don't we have the worst metrics in the league in terms of attacking stats? Surprise. Not.
|
|
|
|
Post by Hobhead on Oct 20, 2018 17:26:53 GMT
After today’s results it’s official. In 2018, of the 92 professional clubs in England we have the fewest points. The worst team in the country. Edin knows football. Anyone else and this might be a wake up call. Not our cunt. |
|
|
|
Post by bantam147 on Oct 21, 2018 14:37:29 GMT
We're now 8/13 to go down.
Fuck. Me.
|
|
|
|
Post by Neshead on Oct 21, 2018 14:41:22 GMT
We're now 8/13 to go down. Fuck. Me. 500/1 to finish in the top two. Eoin Doyle 40/1 to finish top goalscorer. Lump on ladies. |
|
|
|
Post by Hobhead on Oct 21, 2018 17:11:26 GMT
We are fucked: 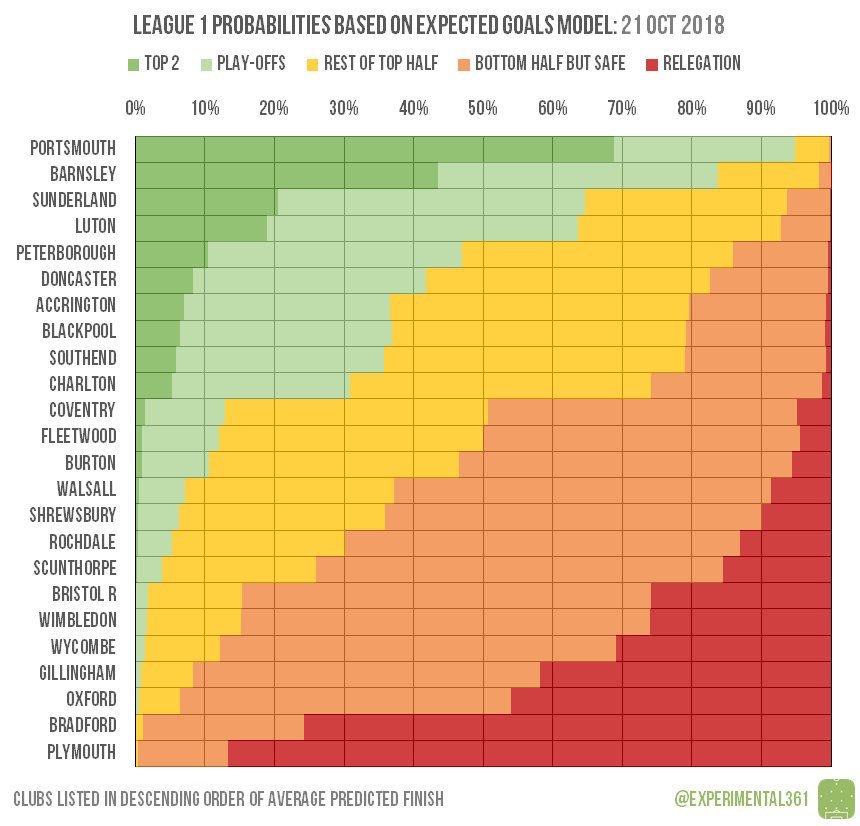 |
|
|
|
Post by Lofty on Oct 21, 2018 17:37:43 GMT
We are fucked: This guys method is pretty much always spot on. We're fucked. |
|
|
|
Post by Attentive Onlooker on Oct 21, 2018 17:49:37 GMT
We are fucked: This guys method is pretty much always spot on. We're fucked. It isn't. We were going up as champions a couple of years ago. |
|
|
|
Post by Lofty on Oct 21, 2018 18:43:36 GMT
This guys method is pretty much always spot on. We're fucked. It isn't. We were going up as champions a couple of years ago. Not for long. Perhaps we'll finish 4th bottom. That'll be a good achievement. Prove this cunt wrong. |
|
|
|
Post by skybantam on Oct 21, 2018 21:32:49 GMT
I only understand a very traditional bar graph or at a push, a pie chart. The colours at, what i assume is the arse end of the chart appear to resemble our new kit. Maybe it's just the lager.
|
|
|
|
Post by Hobhead on Oct 21, 2018 21:40:11 GMT
I only understand a very traditional bar graph or at a push, a pie chart. The colours at, what i assume is the arse end of the chart appear to resemble our new kit. Maybe it's just the lager. It’s an ‘expected goals’ model. Basically it takes into account how many goals a team has scored, who they have to play, who they’ve already played and where they are in the table and how likely they are to score and concede when you do play them, works out how many goals the team is likely to get and how many points that will get them then shows the likelihood of where that team will finish in the table as a result. It showing that we have a seventy five percent chance of relegation. In short, we’re every bit as fucked as we thought we were. |
|
|
|
Post by skybantam on Oct 21, 2018 21:47:03 GMT
I only understand a very traditional bar graph or at a push, a pie chart. The colours at, what i assume is the arse end of the chart appear to resemble our new kit. Maybe it's just the lager. It’s an ‘expected goals’ model. Basically it takes into account how many goals a team has scored, who they have to play, who they’ve already played and where they are in the table and how likely they are to score and concede when you do play them, works out how many goals the team is likely to get and how many points that will get them then shows the likelihood of where that team will finish in the table as a result. It showing that we have a seventy five percent chance of relegation. In short, we’re every bit as fucked as we thought we were. Cheers. You should be a teacher. Hanging on every word i was. They never do that in Hoochies class. |
|
|
|
Post by Attentive Onlooker on Oct 21, 2018 21:49:42 GMT
It’s an ‘expected goals’ model. Basically it takes into account how many goals a team has scored, who they have to play, who they’ve already played and where they are in the table and how likely they are to score and concede when you do play them, works out how many goals the team is likely to get and how many points that will get them then shows the likelihood of where that team will finish in the table as a result. It showing that we have a seventy five percent chance of relegation. In short, we’re every bit as fucked as we thought we were. You should be a teacher. Hanging on every word i was. They never do that in Hoochies class. Should you be in Hoochy's class? |
|
|
|
Post by skybantam on Oct 21, 2018 21:52:54 GMT
You should be a teacher. Hanging on every word i was. They never do that in Hoochies class. Should you be in Hoochy's class? No. They're on holiday right now. Anyway, I don't think they cover that graph in the scottish curriculum owing to their leagues being even more tinpot than our football club. He couldn't explain it with as well as Hobhead tbf. |
|
|
|
Post by fish on Oct 21, 2018 21:55:04 GMT
We don't need some fancy graph to tell us we're shite and we're going down.
Edin out.
|
|
|
|
Post by skybantam on Oct 21, 2018 21:56:02 GMT
We don't need some fancy graph to tell us we're shite and we're going down. Edin out. Wise words. Quite correct. |
|
|
|
Post by The Granby Mullet on Oct 22, 2018 13:19:45 GMT
We're now 8/13 to go down. Fuck. Me. I put £50 on us at 8/1  |
|
|
|
Post by Dennis on Oct 22, 2018 16:11:22 GMT
We're now 8/13 to go down. Fuck. Me. I put £50 on us at 8/1 That should cover most of the billboard costs!  |
|
|
|
Post by jdc on Oct 22, 2018 19:25:44 GMT
We're now 8/13 to go down. Fuck. Me. I put £50 on us at 8/1 Fucking wish I had. I remember looking up the odds and it was about 6-1. Why I didn't place that bet I'll never know. Fucking idiot. |
|
|
|
Post by The Granby Mullet on Oct 23, 2018 9:25:41 GMT
I put £50 on us at 8/1 Fucking wish I had. I remember looking up the odds and it was about 6-1. Why I didn't place that bet I'll never know. Fucking idiot. There's a City fan I know who put £100 down pre season 8/1 and then double downed 3 games in at 6's so he's looking in good shape currently. He's never fancied Rahic from the off. Should soften the blow at the end of the season. |
|


